24. Command Line Utilities
Several command line utilities which are provided with FreeNAS® are demonstrated in this section.
The following utilities can be used for benchmarking and performance testing:
- Iperf: used for measuring maximum TCP and UDP bandwidth performance
- Netperf: a tool for measuring network performance
- IOzone: filesystem benchmark utility used to perform a broad filesystem analysis
- arcstat: used to gather ZFS ARC statistics
The following utilities are specific to RAID controllers:
- tw_cli:_used to monitor and maintain 3ware RAID controllers
- MegaCli: used to configure and manage Avago MegaRAID SAS family of RAID controllers
This section also describes the following utilities:
- freenas-debug: the backend used to dump FreeNAS® debugging information
- tmux: a terminal multiplexer similar to GNU screen
- Dmidecode: reports information about system hardware as described in the system’s BIOS
24.1. Iperf
Iperf is a utility for measuring maximum TCP and UDP bandwidth performance. It can be used to chart network throughput over time. For example, you can use it to test the speed of different types of shares to determine which type best performs on your network.
FreeNAS® includes the Iperf server. To perform network testing, you will need to install an Iperf client on a desktop system that has network access to the FreeNAS® system. This section will demonstrate how to use the xjperf GUI client as it works on Windows, Mac OS X, Linux, and BSD systems.
Since this client is java based, you will also need to install the appropriate JRE for the client operating system.
Linux and BSD users will need to install the iperf package using their operating system’s package management system.
To start xjperf on Windows: unzip the downloaded file, start Command Prompt in Run as administrator mode, cd to the unzipped folder, and run jperf.bat.
To start xjperf on Mac OS X, Linux, or BSD, unzip the downloaded file, cd to the unzipped directory, type chmod u+x jperf.sh, and run ./jperf.sh.
Once the client is ready, you need to start the Iperf server on FreeNAS®. To see the available server options, open Shell and type:
iperf --help | more
Usage: iperf [-s|-c host] [options]
iperf [-h|--help] [-v|--version]

Client/Server:
-f, --format   [kmKM]  format to report: Kbits, Mbits, KBytes, MBytes
-i, --interval #       seconds between periodic bandwidth reports
-l, --len      #[KM]   length of buffer to read or write (default 8 KB)
-m, --print_mss        print TCP maximum segment size (MTU - TCP/IP header)
-o, --output   <filename> output the report or error message to this specified file
-p, --port     #       server port to listen on/connect to
-u, --udp              use UDP rather than TCP
-w, --window   #[KM]   TCP window size (socket buffer size)
-B, --bind     <host>  bind to <host>, an interface or multicast address
-C, --compatibility    for use with older versions does not sent extra msgs
-M, --mss      #       set TCP maximum segment size (MTU - 40 bytes)
-N, --nodelay          set TCP no delay, disabling Nagle's Algorithm
-V, --IPv6Version      Set the domain to IPv6

Server specific:
-s, --server           run in server mode
-U, --single_udp       run in single threaded UDP mode
-D, --daemon           run the server as a daemon

Client specific:
-b, --bandwidth #[KM]  for UDP, bandwidth to send at in bits/sec
                       (default 1 Mbit/sec, implies -u)
-c, --client   <host>  run in client mode, connecting to <host>
-d, --dualtest         Do a bidirectional test simultaneously
-n, --num      #[KM]   number of bytes to transmit (instead of -t)
-r, --tradeoff         Do a bidirectional test individually
-t, --time     #       time in seconds to transmit for (default 10 secs)
-F, --fileinput <name> input the data to be transmitted from a file
-I, --stdin            input the data to be transmitted from stdin
-L, --listenport #     port to receive bidirectional tests back on
-P, --parallel #       number of parallel client threads to run
-T, --ttl      #       time-to-live, for multicast (default 1)
-Z, --linux-congestion <algo> set TCP congestion control algorithm (Linux only)

Miscellaneous:
-x, --reportexclude [CDMSV]    exclude C(connection) D(data) M(multicast) S(settings) V(server) reports
-y, --reportstyle C            report as a Comma-Separated Values
-h, --help                     print this message and quit
-v, --version                  print version information and quit

[KM] Indicates options that support a K or M suffix for kilo- or mega-

The TCP window size option can be set by the environment variable

TCP_WINDOW_SIZE. Most other options can be set by an environment variable
IPERF_<long option name>, such as IPERF_BANDWIDTH.
For example, to perform a TCP test and start the server in daemon mode (so that you get your prompt back), type:
iperf -sD
------------------------------------------------------------
Server listening on TCP port 5001
TCP window size: 64.0 KByte (default)
------------------------------------------------------------
Running Iperf Server as a daemon
The Iperf daemon process ID: 4842
Note
if you close Shell, the daemon process will stop. Have your environment setup (e.g. shares configured and started) before starting the iperf process.
From your desktop, open the client. Input the IP of address of the FreeNAS® system, specify the running time for the test under (the default test time is 10 seconds), and click the “Run Iperf!” button. Figure 24.1a shows an example of the client running on a Windows system while an SFTP transfer is occurring on the network.
Figure 24.1a: Viewing Bandwidth Statistics Using xjperf
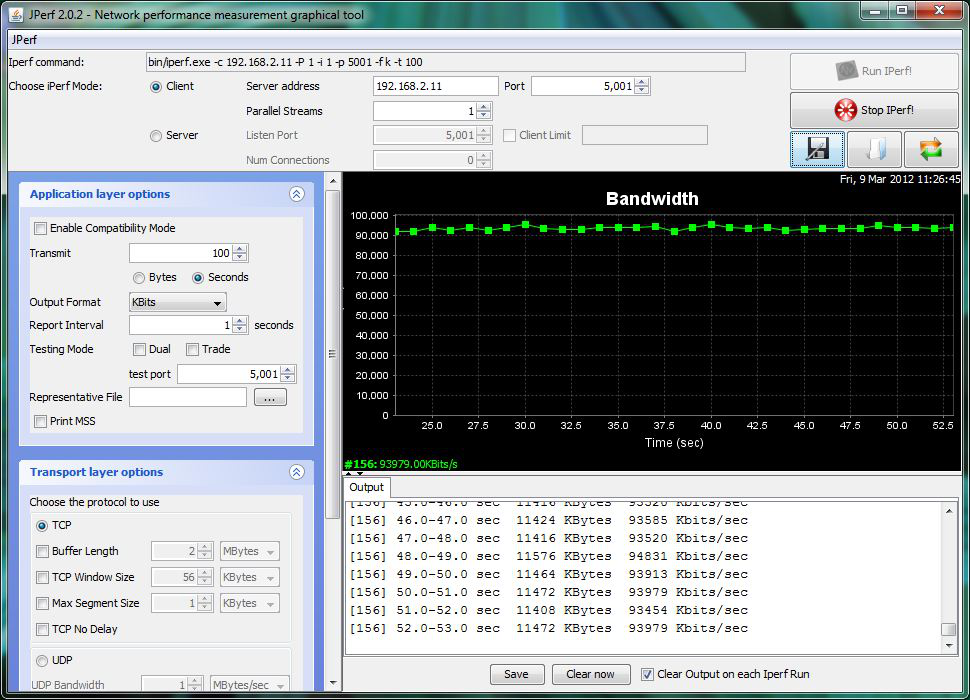
Depending upon the traffic being tested (e.g. the type of share running on your network), you may need to test UDP instead of TCP. To start the iperf server in UDP mode, use iperf -sDu as the u specifies UDP; the startup message should indicate that the server is listening for UDP datagrams. If you are not sure if the traffic that you wish to test is UDP or TCP, run this command to determine which services are running on the FreeNAS® system:
sockstat -4 | more
USER   COMMAND PID     FD PROTO        LOCAL ADDRESS   FOREIGN ADDRESS
root   iperf   4870    6  udp4         *:5001          *:*
root   iperf   4842    6  tcp4         *:5001          *:*
www    nginx   4827    3  tcp4         127.0.0.1:15956 127.0.0.1:9042
www    nginx   4827    5  tcp4         192.168.2.11:80 192.168.2.26:56964
www    nginx   4827    7  tcp4         *:80            *:*
root   sshd    3852    5  tcp4         *:22            *:*
root   python  2503    5  udp4         *:*             *:*
root   mountd  2363    7  udp4         *:812           *:*
root   mountd  2363    8  tcp4         *:812           *:*
root   rpcbind 2359    9  udp4         *:111           *:*
root   rpcbind 2359    10 udp4         *:886           *:*
root   rpcbind 2359    11 tcp4         *:111           *:*
root   nginx   2044    7  tcp4         *:80            *:*
root   python  2029    3  udp4         *:*             *:*
root   python  2029    4  tcp4         127.0.0.1:9042  *:*
root   python  2029    7  tcp4         127.0.0.1:9042  127.0.0.1:15956
root   ntpd    1548    20 udp4         *:123           *:*
root   ntpd    1548    22 udp4         192.168.2.11:123*:*
root   ntpd    1548    25 udp4         127.0.0.1:123   *:*
root   syslogd 1089    6  udp4         127.0.0.1:514   *:*
When you are finished testing, either type killall iperf or close Shell to terminate the iperf server process.
24.2. Netperf
Netperf is a benchmarking utility that can be used to measure the performance of unidirectional throughput and end-to-end latency.
Before you can use the netperf command, you must start its server process using this command:
netserver
Starting netserver with host 'IN(6)ADDR_ANY' port '12865' and family AF_UNSPEC
The following command will display the available options for performing tests with the netperf command. The Netperf Manual describes each option in more detail and explains how to perform many types of tests. It is the best reference for understanding how each test works and how to interpret your results. When you are finished with your tests, type killall netserver to stop the server process.
netperf -h |more
Usage: netperf [global options] -- [test options]
Global options:
    -a send,recv       Set the local send,recv buffer alignment
    -A send,recv       Set the remote send,recv buffer alignment
    -B brandstr        Specify a string to be emitted with brief output
    -c [cpu_rate]      Report local CPU usage
    -C [cpu_rate]      Report remote CPU usage
    -d                 Increase debugging output
    -D [secs,units] *  Display interim results at least every secs seconds
                       using units as the initial guess for units per second
    -f G|M|K|g|m|k     Set the output units
    -F fill_file       Pre-fill buffers with data from fill_file
    -h                 Display this text
    -H name|ip,fam *   Specify the target machine and/or local ip and family
    -i max,min         Specify the max and min number of iterations (15,1)
    -I lvl[,intvl]     Specify confidence level (95 or 99) (99)
                       and confidence interval in percentage (10)
    -j                 Keep additional timing statistics
    -l testlen         Specify test duration (>0 secs) (<0 bytes|trans)
    -L name|ip,fam *   Specify the local ip|name and address family
    -o send,recv       Set the local send,recv buffer offsets
    -O send,recv       Set the remote send,recv buffer offset
    -n numcpu          Set the number of processors for CPU util
    -N                 Establish no control connection, do 'send' side only
    -p port,lport*     Specify netserver port number and/or local port
    -P 0|1             Don't/Do display test headers
    -r                 Allow confidence to be hit on result only
    -s seconds         Wait seconds between test setup and test start
    -S                 Set SO_KEEPALIVE on the data connection
    -t testname        Specify test to perform
    -T lcpu,rcpu       Request netperf/netserver be bound to local/remote cpu
    -v verbosity       Specify the verbosity level
    -W send,recv       Set the number of send,recv buffers
    -v level           Set the verbosity level (default 1, min 0)
    -V                 Display the netperf version and exit
For those options taking two parms, at least one must be specified; specifying one value without a comma will set both parms to that value, specifying a value with a leading comma will set just the second parm, a value with a trailing comma will set just the first. To set each parm to unique values, specify both and separate them with a comma.
For these options taking two parms, specifying one value with no comma will only set the first parms and will leave the second at the default value. To set the second value it must be preceded with a comma or be a comma-separated pair. This is to retain previous netperf behaviour.
24.3. IOzone
IOzone is a disk and filesystem benchmarking tool. It can be used to test file I/O performance for the following operations: read, write, re-read, re-write, read backwards, read strided, fread, fwrite, random read, pread, mmap, aio_read, and aio_write.
FreeNAS® ships with IOzone, meaning that it can be run from Shell. When using IOzone on FreeNAS®, cd to a directory in a volume that you have permission to write to, otherwise you will get an error about being unable to write the temporary file.
Before using IOzone, read through the IOzone documentation PDF as it describes the tests, the many command line switches, and how to interpret your results.
If you have never used this tool before, these resources provide good starting points on which tests to run, when to run them, and how to interpret the results:
- How To Measure Linux Filesystem I/O Performance With iozone
- Analyzing NFS Client Performance with IOzone
- 10 iozone Examples for Disk I/O Performance Measurement on Linux
You can receive a summary of the available switches by typing the following command. As you can see from the number of options, IOzone is comprehensive and it may take some time to learn how to use the tests effectively.
Starting with version 9.2.1, FreeNAS® enables compression on newly created ZFS pools by default. Since IOzone creates test data that is compressible, this can skew test results. To configure IOzone to generate incompressible test data, include the options -+w 1 -+y 1 -+C 1.
Alternatively, consider temporarily disabling compression on the ZFS pool or dataset when running IOzone benchmarks.
Note
if you prefer to visualize the collected data, scripts are available to render IOzone’s output in Gnuplot.
iozone -h | more
iozone: help mode
Usage: iozone[-s filesize_Kb] [-r record_size_Kb] [-f [path]filename] [-h]
             [-i test] [-E] [-p] [-a] [-A] [-z] [-Z] [-m] [-M] [-t children]
             [-l min_number_procs] [-u max_number_procs] [-v] [-R] [-x] [-o]
             [-d microseconds] [-F path1 path2...] [-V pattern] [-j stride]
             [-T] [-C] [-B] [-D] [-G] [-I] [-H depth] [-k depth] [-U mount_point]
             [-S cache_size] [-O] [-L cacheline_size] [-K] [-g maxfilesize_Kb]
             [-n minfilesize_Kb] [-N] [-Q] [-P start_cpu] [-e] [-c] [-b Excel.xls]
             [-J milliseconds] [-X write_telemetry_filename] [-w] [-W]
             [-Y read_telemetry_filename] [-y minrecsize_Kb] [-q maxrecsize_Kb]
             [-+u] [-+m cluster_filename] [-+d] [-+x multiplier] [-+p # ]
             [-+r] [-+t] [-+X] [-+Z] [-+w percent dedupable] [-+y percent_interior_dedup]
             [-+C percent_dedup_within]
         -a  Auto mode
         -A  Auto2 mode
         -b Filename  Create Excel worksheet file
         -B  Use mmap() files
         -c  Include close in the timing calculations
         -C  Show bytes transferred by each child in throughput testing
         -d #  Microsecond delay out of barrier
         -D  Use msync(MS_ASYNC) on mmap files
         -e  Include flush (fsync,fflush) in the timing calculations
         -E  Run extension tests
         -f  filename to use
         -F  filenames for each process/thread in throughput test
         -g #  Set maximum file size (in Kbytes) for auto mode (or #m or #g)
         -G  Use msync(MS_SYNC) on mmap files
         -h  help
         -H #  Use POSIX async I/O with # async operations
         -i #  Test to run (0=write/rewrite, 1=read/re-read, 2=random-read/write
               3=Read-backwards, 4=Re-write-record, 5=stride-read, 6=fwrite/re-fwrite
               7=fread/Re-fread, 8=random_mix, 9=pwrite/Re-pwrite, 10=pread/Re-pread
               11=pwritev/Re-pwritev, 12=preadv/Re-preadv)
         -I  Use VxFS VX_DIRECT, O_DIRECT,or O_DIRECTIO for all file operations
         -j #  Set stride of file accesses to (# * record size)
         -J #  milliseconds of compute cycle before each I/O operation
         -k #  Use POSIX async I/O (no bcopy) with # async operations
         -K  Create jitter in the access pattern for readers
         -l #  Lower limit on number of processes to run
         -L #  Set processor cache line size to value (in bytes)
         -m  Use multiple buffers
         -M  Report uname -a output
         -n #  Set minimum file size (in Kbytes) for auto mode (or #m or #g)
         -N  Report results in microseconds per operation
         -o  Writes are synch (O_SYNC)
         -O  Give results in ops/sec.
         -p  Purge on
         -P #  Bind processes/threads to processors, starting with this cpu
         -q #  Set maximum record size (in Kbytes) for auto mode (or #m or #g)
         -Q  Create offset/latency files
         -r #  record size in Kb
            or -r #k .. size in Kb
            or -r #m .. size in Mb
            or -r #g .. size in Gb
         -R  Generate Excel report
         -s #  file size in Kb
            or -s #k .. size in Kb
            or -s #m .. size in Mb
            or -s #g .. size in Gb
         -S #  Set processor cache size to value (in Kbytes)
         -t #  Number of threads or processes to use in throughput test
         -T  Use POSIX pthreads for throughput tests
         -u #  Upper limit on number of processes to run
         -U  Mount point to remount between tests
         -v  version information
         -V #  Verify data pattern write/read
         -w  Do not unlink temporary file
         -W  Lock file when reading or writing
         -x  Turn off stone-walling
         -X filename  Write telemetry file. Contains lines with (offset reclen compute_time) in ascii
         -y #  Set minimum record size (in Kbytes) for auto mode (or #m or #g)
         -Y filename  Read telemetry file. Contains lines with (offset reclen compute_time) in ascii
         -z  Used in conjunction with -a to test all possible record sizes
         -Z  Enable mixing of mmap I/O and file I/O
         -+E Use existing non-Iozone file for read-only testing
         -+K Sony special. Manual control of test 8.
         -+m Cluster_filename  Enable Cluster testing
         -+d File I/O diagnostic mode. (To troubleshoot a broken file I/O subsystem)
         -+u Enable CPU utilization output (Experimental)
         -+x # Multiplier to use for incrementing file and record sizes
         -+p # Percentage of mix to be reads
         -+r Enable O_RSYNC|O_SYNC for all testing.
         -+t Enable network performance test. Requires -+m
         -+n No retests selected.
         -+k Use constant aggregate data set size.
         -+q Delay in seconds between tests.
         -+l Enable record locking mode.
         -+L Enable record locking mode, with shared file.
         -+B Sequential mixed workload.
         -+A # Enable madvise. 0 = normal, 1=random, 2=sequential 3=dontneed, 4=willneed
         -+N Do not truncate existing files on sequential writes.
         -+S # Dedup-able data is limited to sharing within each numerically identified file set
         -+V Enable shared file. No locking.
         -+X Enable short circuit mode for filesystem testing ONLY
             ALL Results are NOT valid in this mode.
         -+Z Enable old data set compatibility mode. WARNING.. Published
             hacks may invalidate these results and generate bogus, high values for results.
         -+w ## Percent of dedup-able data in buffers.
         -+y ## Percent of dedup-able within & across files in buffers.
         -+C ## Percent of dedup-able within & not across files in buffers.
         -+H Hostname  Hostname of the PIT server.
         -+P Service  Service of the PIT server.
         -+z Enable latency histogram logging.
24.4. arcstat
Arcstat is a script that prints out ZFS ARC statistics. Originally it was a perl script created by Sun. That perl script was ported to FreeBSD and was then ported as a Python script for use on FreeNAS®.
Watching ARC hits/misses and percentages will provide an indication of how well your ZFS pool is fetching from the ARC rather than using disk I/O. Ideally, you want as many things fetching from cache as possible. Keep your load in mind as you review the stats. For random reads, expect a miss and having to go to disk to fetch the data. For cached reads, expect it to pull out of the cache and have a hit.
Like all cache systems, the ARC takes time to fill with data. This means that it will have a lot of misses until the pool has been in use for a while. If there continues to be lots of misses and high disk I/O on cached reads, there is cause to investigate further and tune the system.
The FreeBSD ZFS Tuning Guide provides some suggestions for commonly tuned sysctl values. It should be noted that performance tuning is more of an art than a science and that any changes you make will probably require several iterations of tune and test. Be aware that what needs to be tuned will vary depending upon the type of workload and that what works for one person’s network may not benefit yours.
In particular, the value of pre-fetching depends upon the amount of memory and the type of workload, as seen in these two examples:
FreeNAS® provides two command line scripts which an be manually run from Shell:
- arc_summary.py: provides a summary of the statistics
- arcstat.py: used to watch the statistics in real time
The advantage of these scripts is that they can be used to provide real time (right now) information, whereas the current GUI reporting mechanism is designed to only provide graphs charted over time.
This forum post demonstrates some examples of using these scripts with hints on how to interpret the results.
To view the help for arcstat.py:
arcstat.py -h
Usage: arcstat [-hvx] [-f fields] [-o file] [-s string] [interval [count]]
-h: Print this help message
-v: List all possible field headers and definitions
-x: Print extended stats
-f: Specify specific fields to print (see -v)
-o: Redirect output to the specified file
-s: Override default field separator with custom character or string

Examples:
arcstat -o /tmp/a.log 2 10
arcstat -s "," -o /tmp/a.log 2 10
arcstat -v
arcstat -f time,hit%,dh%,ph%,mh% 1
To view ARC statistics in real time, specify an interval and a count. This command will display every 1 second for a count of five.
arcstat.py 1 5
time           read    miss    miss%   dmis    dm%     pmis    pm%     mmis    mm%     arcsz   c
06:19:03         7     0       0       0       0       0       0       0       0       153M    6.6G
06:19:04       257     0       0       0       0       0       0       0       0       153M    6.6G
06:19:05       193     0       0       0       0       0       0       0       0       153M    6.6G
06:19:06       193     0       0       0       0       0       0       0       0       153M    6.6G
06:19:07       255     0       0       0       0       0       0       0       0       153M    6.6G
Table 24.4a briefly describes the columns in the output.
Table 24.4a: arcstat Column Descriptions
| Column | Description |
|---|---|
| read | total ARC accesses/second |
| miss | ARC misses/second |
| miss% | ARC miss percentage |
| dmis | demand data misses/second |
| dm% | demand data miss percentage |
| pmis | prefetch misses per second |
| pm% | prefetch miss percentage |
| mmis | metadata misses/second |
| mm% | metadata miss percentage |
| arcsz | arc size |
| c | arc target size |
This command provides more verbose information:
arcstat.py -v
System Memory:
       2.00%   156.36  MiB Active,     1.49%   116.70  MiB Inact
       39.49%  3.02    GiB Wired,      0.03%   2.53    MiB Cache
       56.97%  4.35    GiB Free,       0.02%   1.23    MiB Gap
       Real Installed:                         8.00    GiB
       Real Available:                 98.65%  7.89    GiB
       Real Managed:                   96.83%  7.64    GiB
       Logical Total:                          8.00    GiB
       Logical Used:                   44.12%  3.53    GiB
       Logical Free:                   55.88%  4.47    GiB
       Kernel Memory:                          226.69  MiB
       Data:                           90.16%  204.39  MiB
       Text:                           9.84%   22.31   MiB
       Kernel Memory Map:                      7.64    GiB
       Size:                           22.56%  1.72    GiB
       Free:                           77.44%  5.92    GiB
       ARC Summary: (HEALTHY)
               Storage pool Version:   5000
               Filesystem Version:     5
               Memory Throttle Count:  0
       ARC Misc:
               Deleted:                0
               Recycle Misses:         0
               Mutex Misses:           0
               Evict Skips:            0
       ARC Size:                       28.39%  1.89    GiB
               Target Size: (Adaptive) 100.00% 6.64    GiB
               Min Size (Hard Limit):  12.50%  850.23  MiB
               Max Size (High Water):  8:1     6.64    GiB
       ARC Size Breakdown:
               Recently Used Cache Size: 50.30% 3.34   GiB
               Frequently Used Cache Size: 49.70% 3.30 GiB
       ARC Hash Breakdown:
               Elements Max:           258.19k
               Elements Current:       100.00% 258.19k
               Collisions:                     157.63k
               Chain Max:                      8
               Chains:                         79.46k
       ARC Total accesses:                     2.25m
               Cache Hit Ratio:        99.94%  2.25m
               Cache Miss Ratio:       0.06%   1.38k
               Actual Hit Ratio:       99.86%  2.25m
               Data Demand Efficiency: 100.00% 1.99m
               Data Prefetch Efficiency: 100.00% 6.11k
               CACHE HITS BY CACHE LIST:
                Anonymously Used:      0.02%   353
                Most Recently Used:    2.70%   60.83k
                Most Frequently Used:  97.22%  2.19m
                Most Recently Used Ghost: 0.06% 1.34k
                Most Frequently Used Ghost: 0.00% 13
               CACHE HITS BY DATA TYPE:
                Demand Data:           88.26%  1.99m
                Prefetch Data:         0.27%   6.11k
                Demand Metadata:       11.47%  258.29k
                Prefetch Metadata:     0.00%   0
               CACHE MISSES BY DATA TYPE:
                Demand Data:           0.00%   0
                Prefetch Data:         0.00%   0
                Demand Metadata:       9.76%   135
                Prefetch Metadata:     90.24%  1.25k
       File-Level Prefetch: (HEALTHY)DMU Efficiency: 10.16m
                Hit Ratio:             80.03%  8.13m
                Miss Ratio:            19.97%  2.03m
                Colinear:                      2.03m
                 Hit Ratio:            0.00%   91
                 Miss Ratio:           100.00% 2.03m
                Stride:                        8.06m
                 Hit Ratio:            100.00% 8.06m
                 Miss Ratio:           0.00%   0
       DMU Misc:
               Reclaim:                        2.03m
                Successes:             0.08%   1.65k
                Failures:              99.92%  2.03m
               Streams:                        72.11k
                +Resets:               0.00%   0
                -Resets:               100.00% 72.11k
               Bogus:                          0
       ZFS Tunable (sysctl):
               kern.maxusers                   384
               vm.kmem_size                    8205963264
               vm.kmem_size_scale              1
               vm.kmem_size_min                0
               vm.kmem_size_max                329853485875
               vfs.zfs.l2c_only_size           0
               vfs.zfs.mfu_ghost_data_lsize    623119872
               vfs.zfs.mfu_ghost_metadata_lsize 348672
               vfs.zfs.mfu_ghost_size          623468544
               vfs.zfs.mfu_data_lsize          302145536
               vfs.zfs.mfu_metadata_lsize      8972288
               vfs.zfs.mfu_size                326883328
               vfs.zfs.mru_ghost_data_lsize    769186304
               vfs.zfs.mru_ghost_metadata_lsize 8935424
               vfs.zfs.mru_ghost_size          778121728
               vfs.zfs.mru_data_lsize          1127638016
               vfs.zfs.mru_metadata_lsize      30442496
               vfs.zfs.mru_size                1274765312
               vfs.zfs.anon_data_lsize         0
               vfs.zfs.anon_metadata_lsize     0
               vfs.zfs.anon_size               279040
               vfs.zfs.l2arc_norw              1
               vfs.zfs.l2arc_feed_again        1
               vfs.zfs.l2arc_noprefetch        1
               vfs.zfs.l2arc_feed_min_ms       200
               vfs.zfs.l2arc_feed_secs         1
               vfs.zfs.l2arc_headroom          2
               vfs.zfs.l2arc_write_boost       8388608
               vfs.zfs.l2arc_write_max         8388608
               vfs.zfs.arc_meta_limit          1783055360
               vfs.zfs.arc_meta_used           594834472
               vfs.zfs.arc_min                 891527680
               vfs.zfs.arc_max                 7132221440
               vfs.zfs.dedup.prefetch          1
               vfs.zfs.mdcomp_disable          0
               vfs.zfs.nopwrite_enabled        1
               vfs.zfs.zfetch.array_rd_sz      1048576
               vfs.zfs.zfetch.block_cap        256
               vfs.zfs.zfetch.min_sec_reap     2
               vfs.zfs.zfetch.max_streams      8
               vfs.zfs.prefetch_disable        0
               vfs.zfs.no_scrub_prefetch       0
               vfs.zfs.no_scrub_io             0
               vfs.zfs.resilver_min_time_ms    3000
               vfs.zfs.free_min_time_ms        1000
               vfs.zfs.scan_min_time_ms        1000
               vfs.zfs.scan_idle               50
               vfs.zfs.scrub_delay             4
               vfs.zfs.resilver_delay          2
               vfs.zfs.top_maxinflight         32
               vfs.zfs.write_to_degraded       0
               vfs.zfs.mg_noalloc_threshold    0
               vfs.zfs.mg_alloc_failures       8
               vfs.zfs.condense_pct            200
               vfs.zfs.metaslab.weight_factor_enable 0
               vfs.zfs.metaslab.preload_enabled 1
               vfs.zfs.metaslab.preload_limit  3
               vfs.zfs.metaslab.unload_delay   8
               vfs.zfs.metaslab.load_pct       50
               vfs.zfs.metaslab.min_alloc_size 10485760
               vfs.zfs.metaslab.df_free_pct    4
               vfs.zfs.metaslab.df_alloc_threshold 131072
               vfs.zfs.metaslab.debug_unload   0
               vfs.zfs.metaslab.debug_load     0
               vfs.zfs.metaslab.gang_bang      131073
               vfs.zfs.ccw_retry_interval      300
               vfs.zfs.check_hostid            1
               vfs.zfs.deadman_enabled         1
               vfs.zfs.deadman_checktime_ms    5000
               vfs.zfs.deadman_synctime_ms     1000000
               vfs.zfs.recover                 0
               vfs.zfs.txg.timeout             5
               vfs.zfs.max_auto_ashift         13
               vfs.zfs.vdev.cache.bshift       16
               vfs.zfs.vdev.cache.size         0
               vfs.zfs.vdev.cache.max          16384
               vfs.zfs.vdev.trim_on_init       1
               vfs.zfs.vdev.write_gap_limit    4096
               vfs.zfs.vdev.read_gap_limit     32768
               vfs.zfs.vdev.aggregation_limit  131072
               vfs.zfs.vdev.scrub_max_active   2
               vfs.zfs.vdev.scrub_min_active   1
               vfs.zfs.vdev.async_write_max_active 10
               vfs.zfs.vdev.async_write_min_active 1
               vfs.zfs.vdev.async_read_max_active 3
               vfs.zfs.vdev.async_read_min_active 1
               vfs.zfs.vdev.sync_write_max_active 10
               vfs.zfs.vdev.sync_write_min_active 10
               vfs.zfs.vdev.sync_read_max_active 10
               vfs.zfs.vdev.sync_read_min_active 10
               vfs.zfs.vdev.max_active         1000
               vfs.zfs.vdev.larger_ashift_minimal 1
               vfs.zfs.vdev.bio_delete_disable 0
               vfs.zfs.vdev.bio_flush_disable  0
               vfs.zfs.vdev.trim_max_pending   64
               vfs.zfs.vdev.trim_max_bytes     2147483648
               vfs.zfs.cache_flush_disable     0
               vfs.zfs.zil_replay_disable      0
               vfs.zfs.sync_pass_rewrite       2
               vfs.zfs.sync_pass_dont_compress 5
               vfs.zfs.sync_pass_deferred_free 2
               vfs.zfs.zio.use_uma             1
               vfs.zfs.snapshot_list_prefetch  0
               vfs.zfs.version.ioctl           3
               vfs.zfs.version.zpl             5
               vfs.zfs.version.spa             5000
               vfs.zfs.version.acl             1
               vfs.zfs.debug                   0
               vfs.zfs.super_owner             0
               vfs.zfs.trim.enabled            1
               vfs.zfs.trim.max_interval       1
               vfs.zfs.trim.timeout            30
               vfs.zfs.trim.txg_delay          32
When reading the tunable values, 0 means no, 1 typically means yes, and any other number represents a value. To receive a brief description of a “sysctl” value, use sysctl -d. For example:
sysctl -d vfs.zfs.zio.use_uma
vfs.zfs.zio.use_uma: Use uma(9) for ZIO allocations
The ZFS tunables require a fair understanding of how ZFS works, meaning that you will be reading man pages and searching for the meaning of acronyms you are unfamiliar with. Do not change a tunable’s value without researching it first. If the tunable takes a numeric value (rather than 0 for no or 1 for yes), do not make one up. Instead, research examples of beneficial values that match your workload.
If you decide to change any of the ZFS tunables, continue to monitor the system to determine the effect of the change. It is recommended that you test your changes first at the command line using sysctl. For example, to disable pre-fetch (i.e. change disable to 1 or yes):
sysctl vfs.zfs.prefetch_disable=1
vfs.zfs.prefetch_disable: 0 -> 1
The output will indicate the old value followed by the new value. If the change is not beneficial, change it back to the original value. If the change turns out to be beneficial, you can make it permanent by creating a “sysctl” using the instructions in Tunables.
24.5. tw_cli
FreeNAS® includes the tw_cli command line utility for providing controller, logical unit, and drive management for AMCC/3ware ATA RAID Controllers. The supported models are listed in the man pages for the twe(4) and twa(4) drivers.
Before using this command, read its man page as it describes the terminology and provides some usage examples.
If you type tw_cli in Shell, the prompt will change, indicating that you have entered interactive mode where you can run all sorts of maintenance commands on the controller and its arrays.
Alternately, you can specify one command to run. For example, to view the disks in the array:
tw_cli /c0 show
Unit   UnitType        Status  %RCmpl  %V/I/M  Stripe  Size(GB)        Cache   AVrfy
------------------------------------------------------------------------------
u0     RAID-6          OK      -       -       256K    5587.88         RiW     ON
u1     SPARE           OK      -       -       -       931.505         -       OFF
u2     RAID-10         OK      -       -       256K    1862.62         RiW     ON

VPort Status   Unit    Size            Type    Phy Encl-Slot   Model
------------------------------------------------------------------------------
p8     OK      u0      931.51 GB SAS   -       /c0/e0/slt0     SEAGATE ST31000640SS
p9     OK      u0      931.51 GB SAS   -       /c0/e0/slt1     SEAGATE ST31000640SS
p10    OK      u0      931.51 GB SAS   -       /c0/e0/slt2     SEAGATE ST31000640SS
p11    OK      u0      931.51 GB SAS   -       /c0/e0/slt3     SEAGATE ST31000640SS
p12    OK      u0      931.51 GB SAS   -       /c0/e0/slt4     SEAGATE ST31000640SS
p13    OK      u0      931.51 GB SAS   -       /c0/e0/slt5     SEAGATE ST31000640SS
p14    OK      u0      931.51 GB SAS   -       /c0/e0/slt6     SEAGATE ST31000640SS
p15    OK      u0      931.51 GB SAS   -       /c0/e0/slt7     SEAGATE ST31000640SS
p16    OK      u1      931.51 GB SAS   -       /c0/e0/slt8     SEAGATE ST31000640SS
p17    OK      u2      931.51 GB SATA  -       /c0/e0/slt9     ST31000340NS
p18    OK      u2      931.51 GB SATA  -       /c0/e0/slt10    ST31000340NS
p19    OK      u2      931.51 GB SATA  -       /c0/e0/slt11    ST31000340NS
p20    OK      u2      931.51 GB SATA  -       /c0/e0/slt15    ST31000340NS

Name   OnlineState     BBUReady        Status  Volt    Temp    Hours   LastCapTest
---------------------------------------------------------------------------
bbu    On              Yes             OK      OK      OK      212     03-Jan-2012
Or, to review the event log:
tw_cli /c0 show events
Ctl    Date                            Severity        AEN Message
------------------------------------------------------------------------------
c0     [Thu Feb 23 2012 14:01:15]      INFO            Battery charging started
c0     [Thu Feb 23 2012 14:03:02]      INFO            Battery charging completed
c0     [Sat Feb 25 2012 00:02:18]      INFO            Verify started: unit=0
c0     [Sat Feb 25 2012 00:02:18]      INFO            Verify started: unit=2,subunit=0
c0     [Sat Feb 25 2012 00:02:18]      INFO            Verify started: unit=2,subunit=1
c0     [Sat Feb 25 2012 03:49:35]      INFO            Verify completed: unit=2,subunit=0
c0     [Sat Feb 25 2012 03:51:39]      INFO            Verify completed: unit=2,subunit=1
c0     [Sat Feb 25 2012 21:55:59]      INFO            Verify completed: unit=0
c0     [Thu Mar 01 2012 13:51:09]      INFO            Battery health check started
c0     [Thu Mar 01 2012 13:51:09]      INFO            Battery health check completed
c0     [Thu Mar 01 2012 13:51:09]      INFO            Battery charging started
c0     [Thu Mar 01 2012 13:53:03]      INFO            Battery charging completed
c0     [Sat Mar 03 2012 00:01:24]      INFO            Verify started: unit=0
c0     [Sat Mar 03 2012 00:01:24]      INFO            Verify started: unit=2,subunit=0
c0     [Sat Mar 03 2012 00:01:24]      INFO            Verify started: unit=2,subunit=1
c0     [Sat Mar 03 2012 04:04:27]      INFO            Verify completed: unit=2,subunit=0
c0     [Sat Mar 03 2012 04:06:25]      INFO            Verify completed: unit=2,subunit=1
c0     [Sat Mar 03 2012 16:22:05]      INFO            Verify completed: unit=0
c0     [Thu Mar 08 2012 13:41:39]      INFO            Battery charging started
c0     [Thu Mar 08 2012 13:43:42]      INFO            Battery charging completed
c0     [Sat Mar 10 2012 00:01:30]      INFO            Verify started: unit=0
c0     [Sat Mar 10 2012 00:01:30]      INFO            Verify started: unit=2,subunit=0
c0     [Sat Mar 10 2012 00:01:30]      INFO            Verify started: unit=2,subunit=1
c0     [Sat Mar 10 2012 05:06:38]      INFO            Verify completed: unit=2,subunit=0
c0     [Sat Mar 10 2012 05:08:57]      INFO            Verify completed: unit=2,subunit=1
c0     [Sat Mar 10 2012 15:58:15]      INFO            Verify completed: unit=0
If you add some disks to the array and they are not showing up in the GUI, try running the following command:
tw_cli /c0 rescan
Use the drives to create units and export them to the operating system. When finished, run camcontrol rescan all and they should now be available in the FreeNAS® GUI.
This forum post contains a handy wrapper script that will notify you of errors.
24.6. MegaCli
MegaCli is the command line interface for the Avago MegaRAID SAS family of RAID controllers. FreeNAS® also includes the mfiutil(8) utility which can be used to configure and manage connected storage devices.
The MegaCli command is quite complex with several dozen options. The commands demonstrated in the Emergency Cheat Sheet can get you started.
24.7. freenas-debug
The FreeNAS® GUI provides an option to save debugging information to a text file using
. This debugging information is created by the freenas-debug command line utility and a copy of
the information is saved to /var/tmp/fndebug.
Using Shell, you can run this command manually to gather the specific debugging information that you need. To see the available options, type:
freenas-debug
usage: /usr/local/bin/freenas-debug <options>
Where options is:
    -e         A list of comma delimited list of email addresses to email the debug log to.
    -a         Dump Active Directory Configuration
    -c         Dump (AD|LDAP) Cache
    -C         Dump CIFS Configuration
    -D         Dump Domain Controller Configuration
    -d         Dump dtrace scripts
    -g         Dump GEOM configuration
    -h         Dump Hardware Configuration
    -I         Dump IPMI Configuration
    -i         Dump iSCSI Configuration
    -j         Dump jails Information
    -l         Dump LDAP Configuration
    -T         Loader Configuration Information
    -n         Dump Network Configuration
    -N         Dump NFS Configuration
    -S         Dump SMART information
    -s         Dump SSL Configuration
    -y         Dump Sysctl Configuration
    -t         Dump System Information
    -v         Dump Boot System File Verification Status and Inconsistencies (if any)
    -z         Dump ZFS configuration
Output will be saved to /var/tmp/fndebug
For example, if you are troubleshooting your Active Directory configuration, try the following commands to generate and view the debug file:
freenas-debug -a

more /var/tmp/fndebug
24.8. tmux
tmux is a terminal multiplexer which enables a number of terminals to be created, accessed, and controlled from a single screen. tmux is an alternative to GNU screen. Similar to screen, tmux can be detached from a screen and continue running in the background, then later reattached. Unlike Shell, tmux allows you to have access to a command prompt while still providing access to the graphical administration screens.
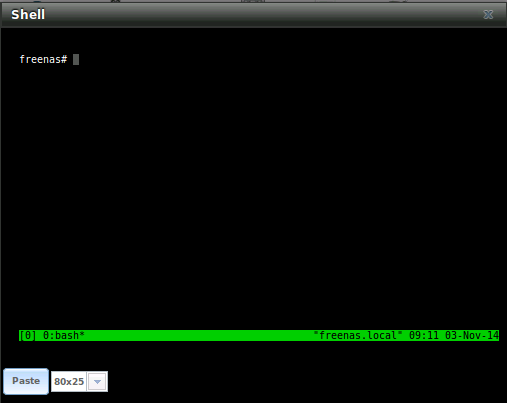
To start a session, simply type tmux. As seen in Figure 24.8a, a new session with a single window will open with a status line at the bottom of the screen. This line shows information on the current session and is used to enter interactive commands.
Figure 24.8a: tmux Session
To create a second window, press Ctrl+b then ". To close a window, type exit within the window.
tmux(1) lists all of the key bindings and commands for interacting with tmux windows and sessions.
If you close Shell while tmux is running, it will detach its session. The next time you open Shell, run tmux attach to return to the previous session. To leave the tmux session entirely, type exit. If you have multiple windows running, you will need to exit out of each first.
These resources provide more information about using tmux:
24.9. Dmidecode
Dmidecode reports hardware information as reported by the system BIOS. Dmidecode does not scan the hardware, it only reports what the BIOS told it to. A sample output can be seen here.
To view the BIOS report, type the command with no arguments:
dmidecode | more
dmidecode(8) describes the supported strings and types.